Splunk Implementation
Why we need a Splunk?
In an e-commerce world you may need to deal with multiple systems which involves upstream systems like product management systems and downstream systems like an e-commerce suite (WCS or ATG or SFCC etc.) or third-party fulfilment systems (OMS). When multiple systems are involved, there should be a need to consolidate the system level data or logs, integration data logs, transactional data logs which can include customer visit counts, unique page visits, inventory data or order per minute (OPM) data.
Instead of searching a needle in a haystack of logs, Splunk helps you finding out a problem quickly by indexing heavy chunk of logs and you can easily search in that specific index then will be able to find out any issues within seconds (or even less than that .in milliseconds). It can even help you triaging a severity 1 production issue!
If we talk about the architecture, consider Splunk as a source of truth where you can ingest all your logs to the Splunk server in a real time fashion.
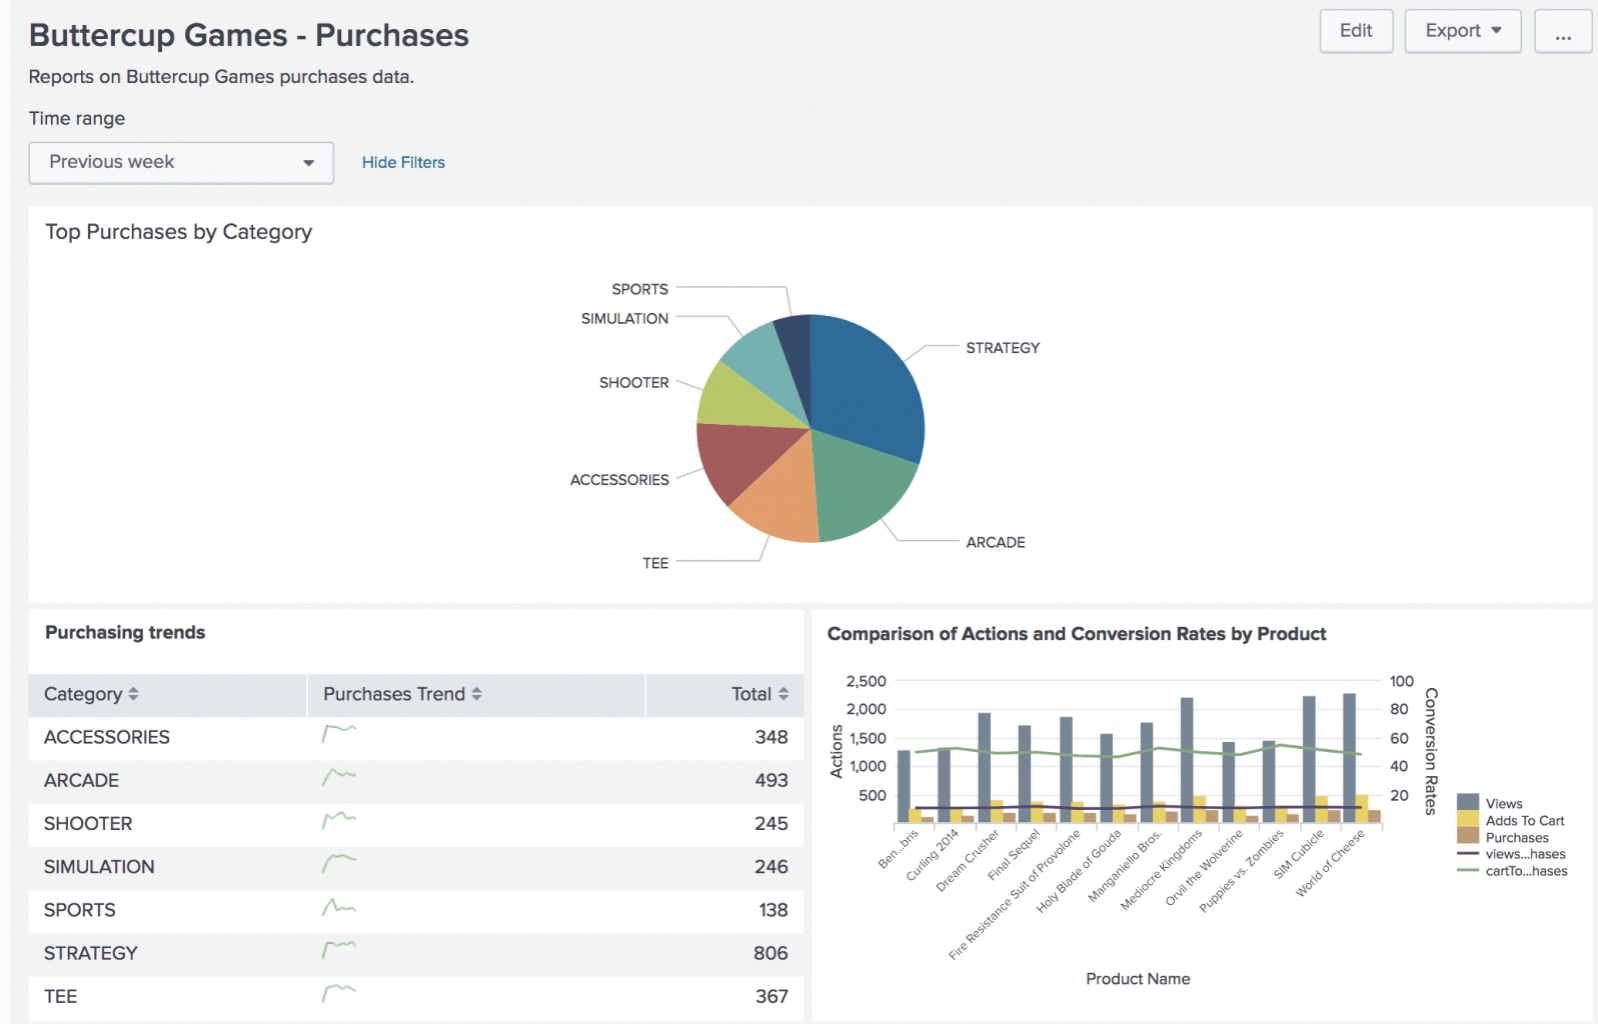
Once everything is set it up, then it is the time where you can configure Splunk to produce beautiful real time dashboards. Let us see an example of a Splunk Dashboard which talks about Purchase Trends (Credit: Splunk)

The above report is generated from inside Splunk Cloud with the help of real time logs which we are ingesting to the Splunk from e-com systems. The second chart gives more detailed view of conversion metrics to understand better on the transaction funnels.
Most importantly to generate various report based on your needs or requirements it is mandatory to have your tech team knows about the Splunk Search Processing Language (SPL). More information can be found at
docs.splunk.com/Documentation/SCS/current/SearchReference/SearchCommandExamplesSplunk Architecture:
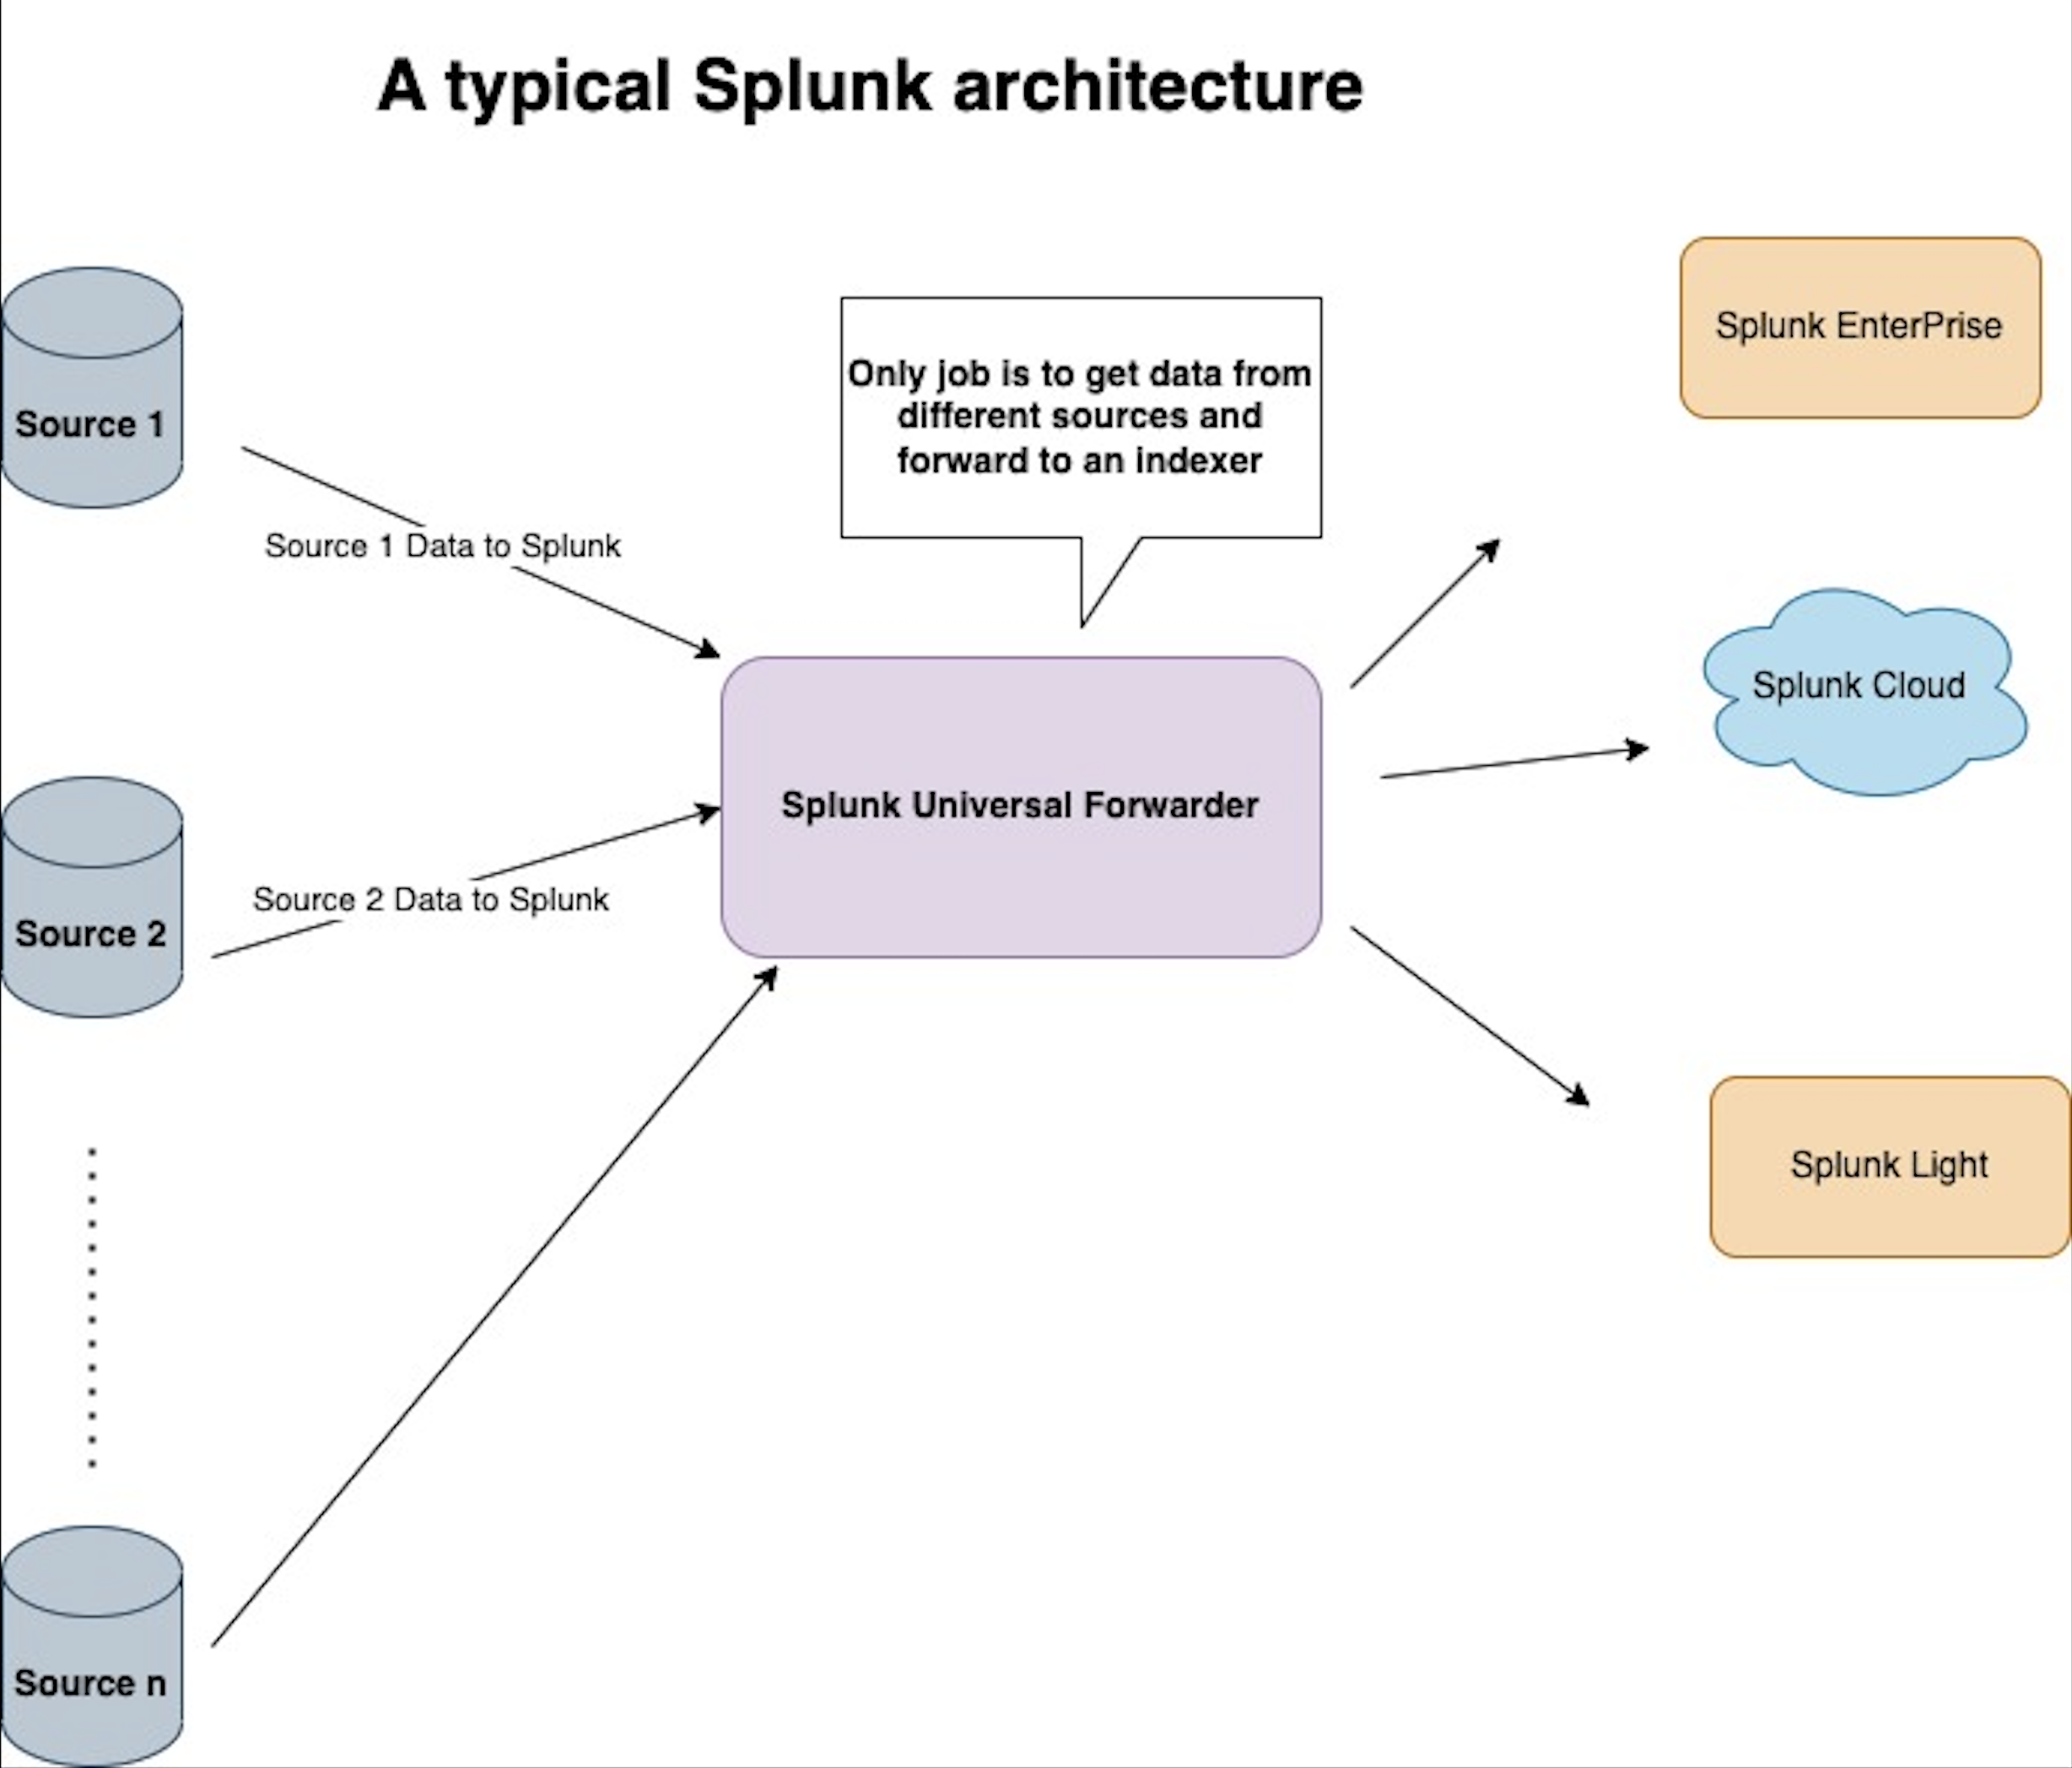
The Splunk Universal Forwarder (SUF) is a small, lightweight application used to forward the data to your Splunk server from a variety of sources.

The above diagram depicts the typical architecture of a Splunk configuration. The Splunk Universal Forwarder collects data from a data source and can send data to Splunk Enterprise, Splunk Light, or Splunk Cloud. The universal forwarder is a Splunk application and available for download as a separate installation from Splunk site.
SPF doesn’t have any index or search capability. It is just a forwarder.
The universal forwarder can collect data from a variety of inputs and forward the data to a Splunk deployment for indexing (Indexer) and searching.
Splunk Universal Forwarder In A AWS Instance ( Linux)
Let us see how a universal forwarder works in AWS instance which is configured to listen to a source system(SFCC). There are two steps involved in it.
- Install Splunk Universal Forwarder In AWS (Linux Instance)
- Configure Splunk Universal Forwarder To Pull Logs From A E-Com System (SFCC) And Forward It To A Splunk Cloud.
Installing Splunk Universal Forwarder In AWS
Let us see how a universal forwarder works in AWS instance which is configured to listen to a source system(SFCC). There are two steps involved in it.
- Login To Your Splunk Cloud Application (Your Company Should Have Provided With You That)
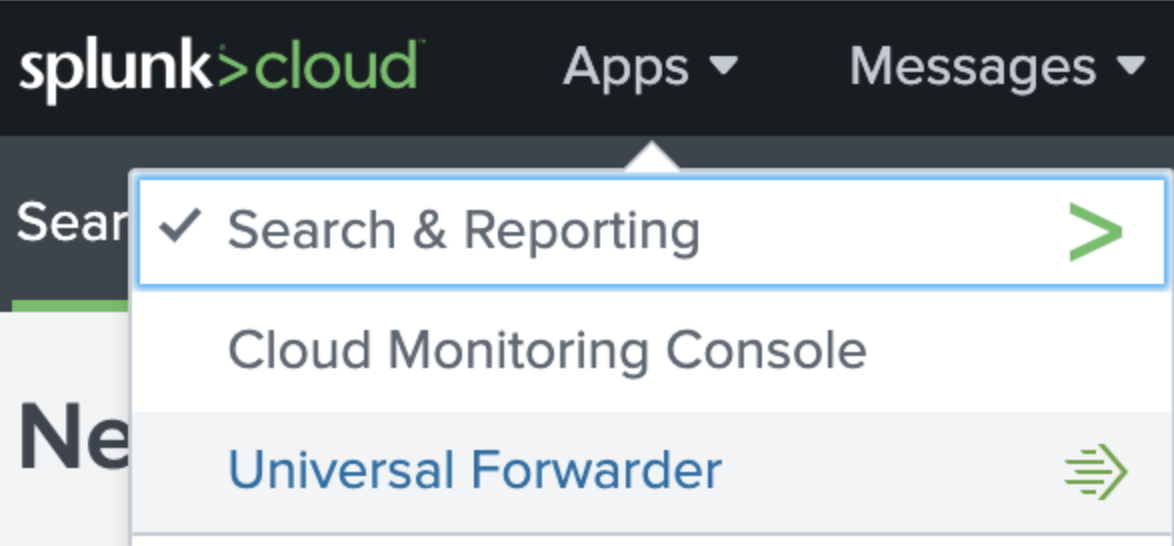
- Go To The Apps - Select Universal Folder.

- Click On The Link Universal Forwarder And Start Downloading Splunk Universal Folder Software For Linux
- Please Make Sure To Download The Splunk Credentials Package Which Will Be Used For Authentication Purpose Later To Connect From AWS Linux System To Splunk Cloud.
- Next Step Is To Install The Splunk Universal Forwarded In AWS Linux Machine.
- Copy The Downloaded Universal Forwarder Software:(Splunkforwarder.Rpm) From Local System Directory And Transfer To AWS Linux Under /Opt Folder.
-
You Can Use The Below SCP Command To Do This Operation:
scp -i splunkforwarder.rpm rpm sdl@squaredatalabs.aws:/opt/ -
Now Install The Splunk Forwarder Using Below Command:
sudo yum localinstall splunkforwarder.rpm -
During The Step You Will Have To Create A Username And Password Which Will Be Used To Manage Splunk Forwarder And Then Go Head And Accept The Agreement.
[ Default User Admin Password Admin@123 ]
-
Next Step Is To Kick Start The Splunk Forwarder By Issuing The Command:
/opt/SplunkForwarder /.splunk start -
You Can Also Edit Default Password At This Time
cd /opt/splunkforwarder/bin sudo ./splunk edit user admin -password admin@123 -auth admin:changeme -
Now Install The Splunk Credentials Package - Copy The Spl Extension File To
/opt/splunkforwarder/etc/appsLocation.
-
scp -I splunkclouduf. rpm
sdl@squaredatalabs.aws:/opt/splunkforwarder/etc/apps -
cd /opt/splunkforwarder/bin ./splunk install
app /opt/splunkforwarder/etc/apps/splunkclouduf.spl -auth admin:admin@123 -
Please Cross Check By Going Into The Directory
cd /opt/splunkforwarder/etc/appsFolder And See If A File With _splunkcloud Is Generated Successfully
You Can Use SCP Commands Same As Previously.
-
-
Now It Is The Time To Restart The Splunk Universal Forwarder - Go To
/opt/SplunkForwarder/bin ./splunk restart/
Configure Splunk Universal Forwarder to pull logs from a e-com system (SFCC)
Since we have splunk forwarder installed by now in AWS, there should be a inputs.conf configuration file which can be located in
/opt/splunkforwarder/etc/system/local
The SFCC custom log puller can periodically pull the logs from Demandware and push the DW logs into these Linux DW log directories.
Pulling logs from demandware and push to AWS directories using custom log puller script
Step - 1 : Clone the repository from github github.com/Pier1/sfcc-splunk-connector
Step - 2 : Login to AWS and copy the asset to /opt/splunkforwarder/etc/apps/sfcc-splunk-connector
Step - 3 : Edit sfccpuller.py and comment out #if(options.insecure)to bypass SSL certificate error
Step - 4 : Edit Config.py and enter your SFCC configuration:DOMAIN = "SFCC HOST"
PATH = "/on/demandware.servlet/webdav/Sites/Logs/"
USER = "YOUR SFCC USERNAME"
PASSWORD = "YOUR SFCC PASSWORD"
PERSIS_DIR = "state"
How to add monitors in inputs.conf file
Open the /opt/splunkforwarder/etc/system/local vi inputs.conf file , Then you can add monitor as follows - Below entries should be added in inputs.conf if SF wants to monitor custom directories. Stanza is provided below: [script://$SPLUNK_HOME/etc/apps/sfcc-splunk-connector/bin/sfcclogpuller.py -p "^error-blade.*" -d "$SPLUNK_HOME/etc/apps/sfcc-splunk-connector/bin/state"]
interval = 15
host = <yourhost>
index = <yourindex>
disabled = 0
sourcetype = <your source type>
source = <your source>
Splunkforwarder will execute a python script which will pull log information from demandware and send to splunk cloud.
Where to see the splunk log
Go to /opt/splunkforwarder/var/log/splunk - search for splunkd.log
Debug Tools
| Commands for debugging or triaging any issues in Splunk | Usage |
|---|---|
sudo ./splunk btool inputs list --debug |
Lists the monitor configuration using btool |
sudo ./splunk list inputstatus |
Lists the basic monitor configuration |
sudo ./splunk btool outputs list |
List the output configuration - Index host information, SSL certificate information etc. |
Enabling debug log f incase of advanced triaging an issue in indexing
Go to /opt/splunkforwarder/etc→ Edit log.cfg → Look for the below entry and turn INFO to DEBUG
                category.TailingProcessor=INFO

                category.WatchedFile=INFO

                category.ArchiveProcessor=INFO

                category.TailReader=INFO
PS - Remember to turn it back to INFO after your triage.
Design considerations around Splunk Indexing
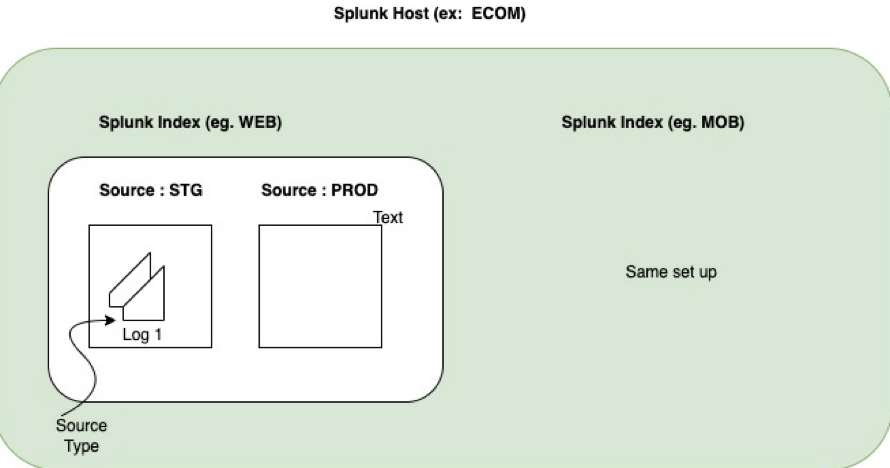
Splunk Fields| host | Your Default Host (AWS). This can be changed to any custom name like ecom by editing system/local inputs.conf & server.conf configuration. |
| index | You can create a new index in splunk cloud – To do that please visit Settings → Data → Indexes. Index can also be configured while defining monitor in inputs.conf file. Designing an index for specific application requires analysis. As an example, if you are running an e-commerce application and if you have mobile application and web application then you can specific separate indexes for both. In this case it would be index=web for web application and index=mobile for mobile applications. So the logs for web application and mobile application will be indexed and processed separately. |
| SourceType | Source Type is the type of the source data. If you want to segregate the logs between info, error or warn you can have ecom:info or ecom:error or ecom:warn as the sourceType. |
| Custom Fields | Please refer the link. You can also create custom fields in splunk cloud → Visit tab Search Extract new fields Use Regex pattern to create a new custom field Please see the upcoming section to know more about it. |
Know the Host , Index , Source and Source Type (Search Query)

Custom Field Creation and extraction of events using regex
Assume there is a scenario where you are feeding logs to the splunk. But you don’t have a field to know about IP address of the incoming requests
But the requirement is to the filter log events by IP address to find a fraudulent attack. In this specific scenario we could create
A custom field called IP address
in splunk cloud.
To do that perform below steps –
- Login to Splunk Cloud.
- Go to settings → Fields → Field Extraction → New Field Extraction → Enter the name as IPAddress → Extraction as regex ( put your regex expression to extract IP address from the log as logxxxxx-(? < IPAddress > \w+)-logxxxxx)
The above regex extract IP address information from the log.
Another way of extracting fields is Go to Search & Reporting→ Apply query (index=*) and then look for extract fields option in left panel bottom. (Preferred way)
After applying field splunk will be able to filter the logs by brand as shown below - Apply Query
index="ecom" host="web"
 sourcetype="ecom:error" source=staging
 site=squaredatalabs IPAddress=”127.0.0.1”
Alias and enviornment variables in Linux system
It is always better to set up Aliases in linux for faster execution of commands All the shortcut aliases are set it up in
sudo vi ~/.bashrc

                alias splunkrestart = “sudo ./splunk restart”
Once added please execute below command to refresh the bash terminal
source vi ~/.bashrc
The enviornment variable SPLUNK_HOME is defined in sudo vi ~/.bash_profile
Make sure below entry is defined there
export SPLUNK_HOME=/opt/splunkforwarder
What should you remember while configuring the logs
Please remember that there is a size constraint (in GBs per day) on Splunk. Please check with your Splunk account manager to know about your quota and consider the size factor when you start sending the log files to Splunk server for indexing


